Solar Stats for June 2023
Reading time: 2 minutes (327 words)Author: @pugmiester
Tags: solar , battery , energy , stats
System specs
16 x 390W panels (6.24kWp) facing almost due south with some shading
GiveEnergy 5kW Hybrid Inverter
GivEnergy 9.5kWh battery
System Location - Manchester, UK
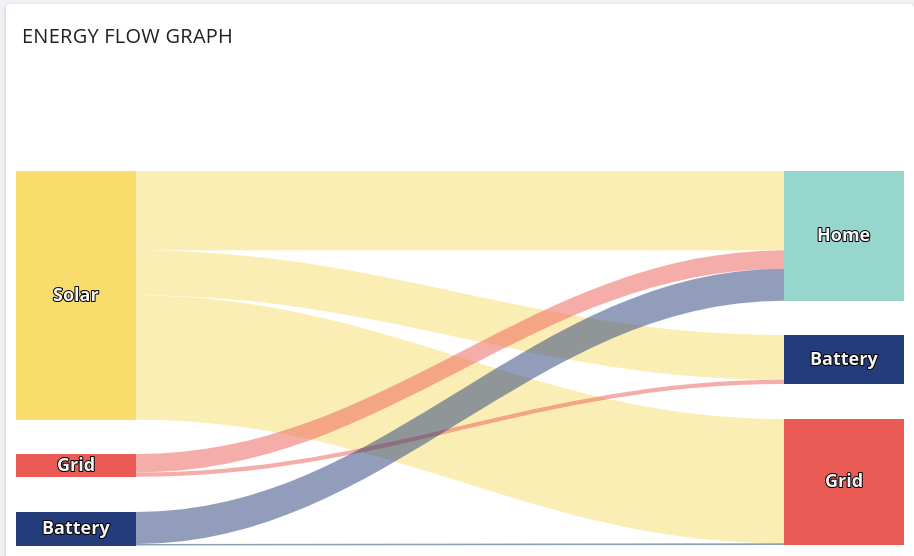
Generation for the month
I’m grabbing data from the GivEnergy cloud because it draws pretty graphs, so I don’t have to.
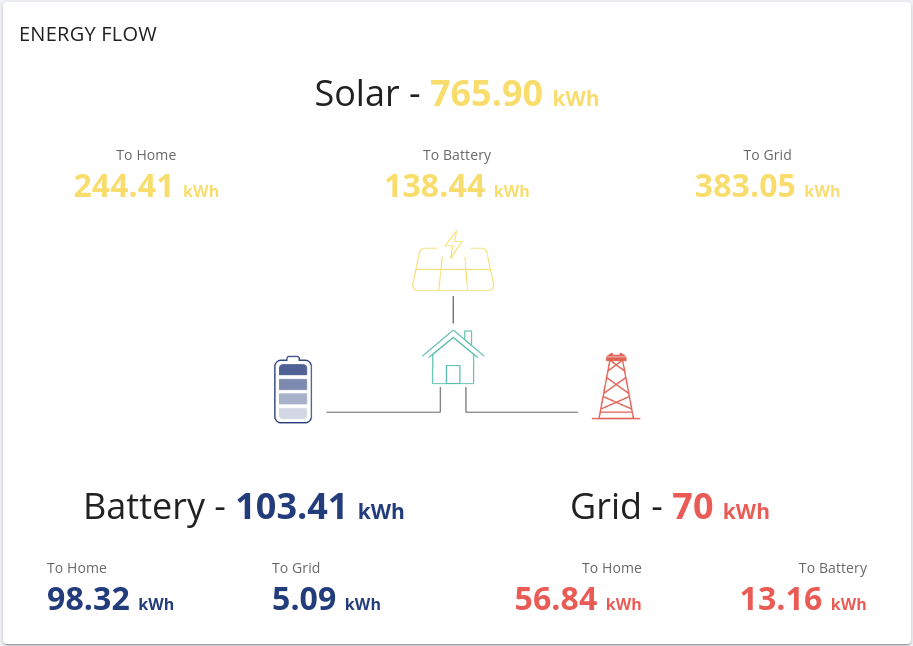
June feels like it was a odd month.
It felt a lot sunnier than May but we only generated about 20kWh more. I need to look at the daily numbers but I’m wondering if this means we’re starting to reach the limit of our system. We’ve only had the system live since November 2022 so I don’t have any historic data to look back on for our system but I’m certainly keeping all the stats I can as the system runs so we can at least see how it’s performing over time.
Based on our installers estimates, using those rule of thumb values they use, we are expecting to generate around 5127kWh per year, an average of around 427kWh per month. Obviously that will dip a lot in the winter months and with the summer months only getting up and around 460kWh per month that seems unlikley but I guess we will have to wait and see.
We still need to either make more use of the solar we are generating, or get paid for what we are exporting and that at least is underway. Our previous Octopus GO tariff fixed rate expired on July 4th so we took the plung and switched over to Agile. Our reasoning was that by switching to Agile we could then also sign up for the Octopus Outgoing Fixed tariff that would net us 15p / kWh for anything we export. Yes, we know there’s also an Agile outgoing tariff but ballancing incoming with charging an EV is something we need to get a handle on before we think about juggling Agile both for import and export. We will see, maybe in the future.